Let’s take a look at the current trending stocks and the factors that have earned the most in previous months. Moreover, learn about statistically significant factors with the potential to deliver long-term returns.
AP on the street wishes you a nice summer!
TRENDING TICKERS

INTC
2. 8. 2024
Poor revenues, struggling in the AI chip market, falling sales. That’s part of why Intel Corporation ranks as one of the most negative trending tickers.
UMGNF
1. 8. 2024
Despite a 7.4% YoY increase in revenue and a 6.9% increase in subscription revenue, Universal Music Group saw a significant selloff
LW
31.7.2024
What’s going on with Lamb Weston Holdings?
The company has fallen into the most negative trending tickers. The blame lies mainly on poor economic results driven by market share losses/ low demand from quick service restaurants

F
30.7.2024
Ford Motor Company fell 22% last week. It reported both poor results and high warrant costs. Despite this, some investors remain bullish, mainly due to dividend consistency and popular consumer products like F-series.
For more AI-based concise summaries and useful meta-information, check out our app. You can also follow the daily updates on our X account Market_sentiment.

TRENDING FACTORS ON S&P 100 STOCK UNIVERSE
TOP GAINER FACTOR IN PREVIOUS 5 MONTHS
DebtEquity
D/E measures a company’s total liabilities to its equity. Read more.
Performance = 12.6%
Signal strength = 1.1 
Statistical confidence = 87.3%
Signal direction = ⬀
TOP LOOSER FACTOR IN PREVIOUS 5 MONTHS
Volume_MOM_10
The factor shows the difference between the current volume and the volume 10 periods ago. Read more.
Performance = -11.5%
Signal strength = 0.3
Statistical confidence = 62.6%
Signal direction = ⬂
STRONG AND STATISTICALLY CONFIDENT FACTOR
WILLR_5
Williams %R is an oscillator-type indicator that shows the relationship between the current closing price and the high and low prices over the latest n days, in this case 5. Read more.
Performance = -1.2%
Signal strength = 3.6 
Statistical confidence = 99.9%
Signal direction = ⬂
Let’s look at the factor in more detail.
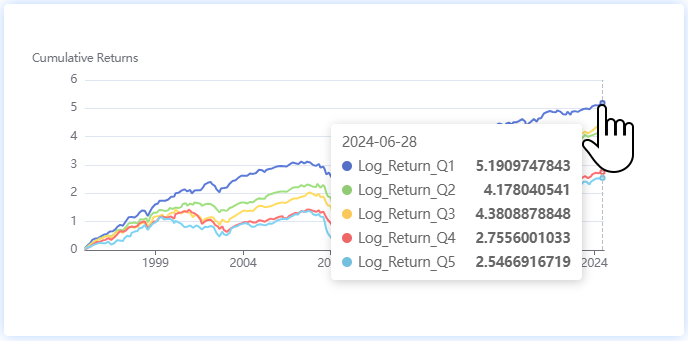
We analyzed the indicator and found that the most growing stocks in the long-term are those with the lowest value for the factor. This gives us the Signal direction. With this knowledge, we are ready to build our factor strategy/ portfolio. In our Factor Investing app, we can select the initial settings.
Strategy and backetst parameters.
Built on factor model: WILLR_5
The portfolio consist of the top 15 assets ranked by the model.
The strategy is using leverage 1 for the invested capital.
100% of the capital is invested uniformly as long positions in the top ranked assets.
0% of the capital is invested uniformly as short positions in the top ranked assets.
0% of the capital is left as cash reserve.
The backtest period begins at: 2020-01-01 and ends at 2024-07-02
Capital of $100000 is initially invested into the strategy.
Multi-period walk-forward out of sample method. This method provides greatest integrity and predictability results. Performance is calculated with end-of-day closing prices. Backtests calculates 0 fees per trade. Dividends are included in cumulative performance, as if they were continuously re-invested.
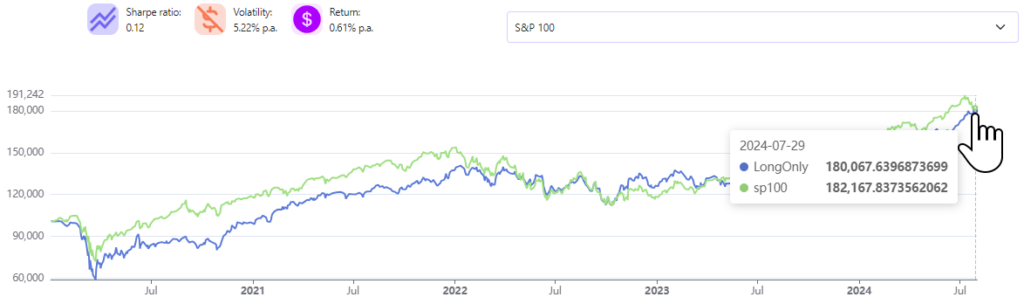
Equity of strategy and benchmark
And what are the results? From the chart we can see that investing in 15 stocks from the S&P 100 index with the lowest WILLR_5 value would have delivered similar returns to the entire index over the last 4 years. We can play with the settings in the parameterization, use leverage or create a LongShort portfolio to achieve attractive results and ultimately complement our investment portfolio.
For a detailed analysis of more than a thousand investment indicators, utilize the Analytical Platform.