Greeting investors!
Newly, we will be providing information on trending companies that are experiencing the biggest moves in sentiment.
We will also introduce the factors that have earned the most over the last month. And because one swallow does not make a spring, we will also report on factors that are statistically significant and have the potential to deliver long-term value.
AP on the street wishes you a nice summer!
TRENDING TICKERS

BOIL (ProShares Bloomberg Natural Gas) reached an enormous increase in news coverage.

MU (Micron Technologies) continues its trending ride and more and more articles are being written about it.

NKE (Nike) has gained 5 times as many articles, with the negative ones dominating.

After the earnings release, FDX (FedEx Corporation) received 6x more positive news than in the average week.

CRWD (Crowdstrike Holdings), which has a 51% CAGR since 2020, gained 4 times as much positive news.
For more AI-based concise summaries and useful meta-information, check out our app.

TRENDING FACTORS
TOP GAINER FACTOR IN PREVIOUS 5 MONTHS
Price_Position_3 factor on S&P 100 stock universe. The calculation is (X-Y)/(Z-Y), where X = last close price, Y = lowest value , Z = highest value.
Performance = 10.7%
Signal strength = 1.7 ❌
Statistical confidence = 95% ❌/ ✔️
STRONG AND STATISTICALLY CONFIDENT FACTOR
CapEx factor refers to “Capital Expenditures”, i.e. the cost of acquiring and renewing physical assets (e.g. plant, property, industrial and technical equipment).
Performance = 2.4%
Signal strength = 3.9 ✔️
Statistical confidence = 99% ✔️
Let’s look at the factor in more detail.
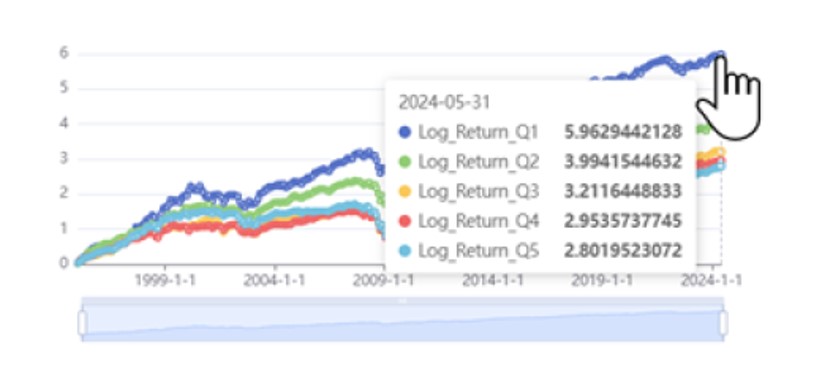
We analyzed the indicator and found that the most growing stocks in the long-term are those with the lowest value for the factor, i.e. with the lowest capital expenditures.
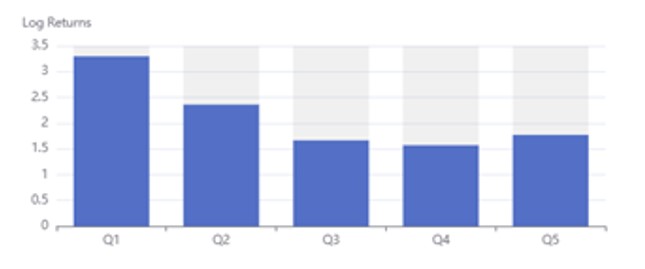
Return Analysis shows that the highest average monthly returns were achieved by stocks in the quintile Q1 with the lowest factor loadings. Q5 does not perform the worst, however, the factor appears to be an appropriate one for the construction of LongShort portfolios.
Constructive ✔️
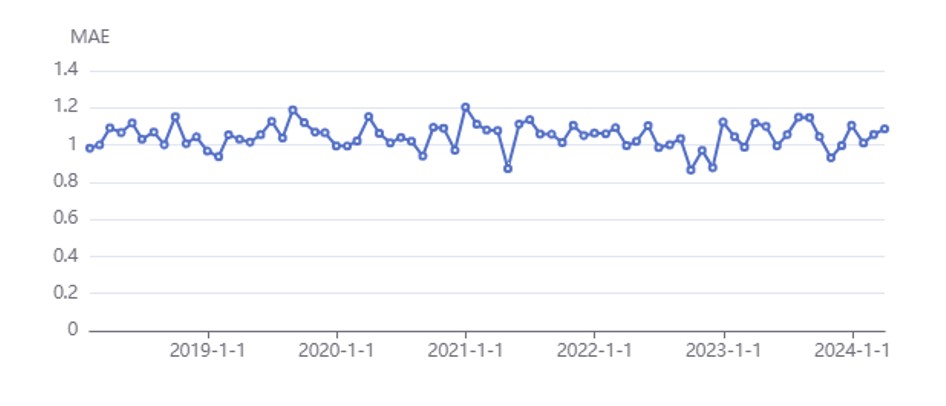
Mean absolute error (MAE) shows how close the model predictions are to the actual values. A lower MAE value means the model makes smaller errors, indicating higher accuracy of the predictions. Simply put, MAE is the average magnitude of the model’s error.
Accomplished ✔️
R² (R-squared) score shows how well the model explains the variability in the actual values. An R² value close to 1 indicates that the model explains changes in values very well. Thus, the R² score helps us understand how effectively the model captures patterns in the data.
Accomplished ✔️
For a detailed analysis of more than a thousand investment indicators, utilize the Analytical Platform.
More articles on our website.