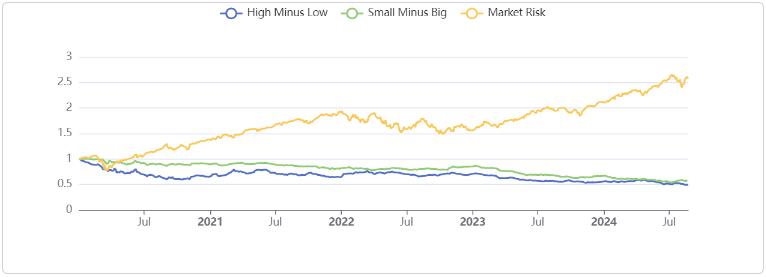
Within our factor investing software, we have algorithmized the calculation of well-known Fama-French factors. In the application, you can see the performance of portfolios based on FF factors. Let’s see how we do it.
Obtaining the necessary data
To calculate Fama/French factors, first, we need to download the price (daily returns) and fundamental data for each ticker in the selected universe (currently we support S&P 100). The fundamental data needed is the following: Market Capitalization, Book-to-Market ratio, Return on Equity, and Total Assets Change.
Sorting tickers
With the data available we sort tickers by each fundament and classify them. The top half of tickers sorted by Market Capitalization (ME) is classified as “Big” and the bottom half is classified as “Small”. The top 30 % of tickers sorted by Book-to-Market (BE/ME) are classified as “Value”, the bottom 30 % are classified as “Growth, and the rest of them as “Neutral”. Similarly with Return on Equity, the top 30 % is marked as “Robust”, the bottom 30 % as “Weak” and “Neutral” everything in between. Finally, the top 30 % of tickers sorted by Total Assets Change are marked as “Aggressive”, the bottom as “Conservative” and the rest are marked as “Neutral”.
Fama-French three factors
The Fama/French 3 factors are constructed using the 6 value-weight (returns weighted by MarketCap) portfolios formed on size (Market Capitalization) and Book-to-Market ratio.

In our case (for simplicity of interpretation, let’s assume that the S&P 100 contains 100 stocks) we have 50 stocks labeled as Small and 50 as Big (according to Market capitalization). This defines 2 columns here. Within Book-to-Market, we label 30 stocks as Value, 30 stocks as Growth, and 40 stocks as Neutral. This defines 3 rows here. Next, we take the intersection of stocks that are both in the Small box and the Value box at the same time and we have the first cell, which is labeled Small Value. We do the same to load the other boxes. Each day we calculate a weighted (by Market cap) average of the returns for all the boxes and use the formulas below to calculate the Equity curve.

- SMB (Small Minus Big) is the average return on the three small portfolios minus the average return on the three big portfolios.
SMB = 1/3 (Small Value + Small Neutral + Small Growth) – 1/3 (Big Value + Big Neutral + Big Growth). - HML (High Minus Low) is the average return on the two value portfolios minus the average return on the two growth portfolios.
HML = 1/2 (Small Value + Big Value) – 1/2 (Small Growth + Big Growth). - Market Premium expresses the excess return on the market. Market Premium (Rm-Rf) is a value-weighted return of all assets in the universe (Rm) minus risk-free rate (Rf, “Market Yield on U.S. Treasury Securities at 1-Month Constant Maturity” downloaded from FRED API).
Rm-Rf is the same for both 3 and 5 factors Fama/French models.
Register today & enjoy one month
FREE trial of our application

Fama-French five factors
The Fama/French 5 factors are constructed using the 6 value-weight portfolios formed on size (Market Capitalization) and Book-to-Market, the 6 value-weight portfolios formed on size and operating profitability, and the 6 value-weight portfolios formed on size and investment. HML and Market Premium are calculated the same as in the 3 factors case.
- SMB (Small Minus Big) is the average return on the nine small stock portfolios minus the average return on the nine big stock portfolios.
SMB(B/M) = 1/3 (Small Value + Small Neutral + Small Growth) – 1/3 (Big Value + Big Neutral + Big Growth).
SMB(OP) =1/3 (Small Robust + Small Neutral + Small Weak) – 1/3 (Big Robust + Big Neutral + Big Weak).
SMB(INV) = 1/3 (Small Conservative + Small Neutral + Small Aggressive) – 1/3 (Big Conservative + Big Neutral + Big Aggressive).
SMB = 1/3 (SMB(B/M) + SMB(OP) + SMB(INV)) - RMW (Robust Minus Weak) is the average return on the two robust operating profitability portfolios minus the average return on the two weak operating profitability portfolios.
RMW = 1/2 (Small Robust + Big Robust) – 1/2 (Small Weak + Big Weak). - CMA (Conservative Minus Aggressive) is the average return on the two conservative investment portfolios minus the average return on the two aggressive investment portfolios.
CMA = 1/2 (Small Conservative + Big Conservative) – 1/2 (Small Aggressive + Big Aggressive).

Ing. Roman Jakl, +420 530 338 810.
Resources utilized
- https://fred.stlouisfed.org/series/DGS1MO
- https://mba.tuck.dartmouth.edu/pages/faculty/ken.french/data_library.html
- https://mba.tuck.dartmouth.edu/pages/faculty/ken.french/Data_Library/f-f_factors.html
- https://mba.tuck.dartmouth.edu/pages/faculty/ken.french/Data_Library/f-f_5_factors_2x3.html
- https://mba.tuck.dartmouth.edu/pages/faculty/ken.french/Data_Library/six_portfolios.html