Let’s look at the factors that have earned the most in previous days and the current trending stocks.
TRENDING FACTORS ON S&P 100 STOCK UNIVERSE
TOP GAINER FACTOR IN PREVIOUS 5 DAYS
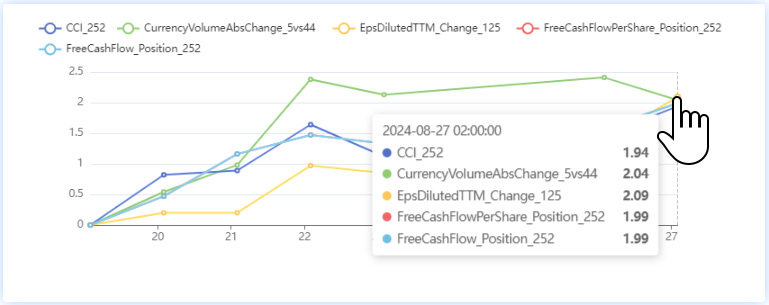
The most earned factor was EPS Diluted TTM Change 125. ‘Diluted EPS’ measures a company’s earnings per share if all convertible securities are exercised at once. ‘TTM’ (Trailing Twelve Months) refers to the past 12 consecutive months of a company’s performance data used for reporting financial figures. ‘125’ expresses the period within which the changes are assessed. The factor performed well over the last week, but in the long term, it is statistically insignificant.
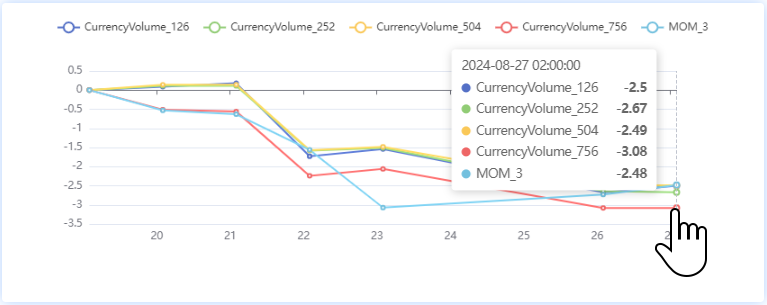
TOP LOSER FACTOR IN PREVIOUS 5 DAYS
The top loser of the week was (Just like in the previous TAOTS) Currency Volume 756 factor. But this is tricky because the factor should be used in reverse. That is, buy the stocks with the lowest value and sell the ones with the highest value. By this logic, it was the most successful indicator.
This is a statistically significant factor. You can find details in the 8th TAOTS of 2024.
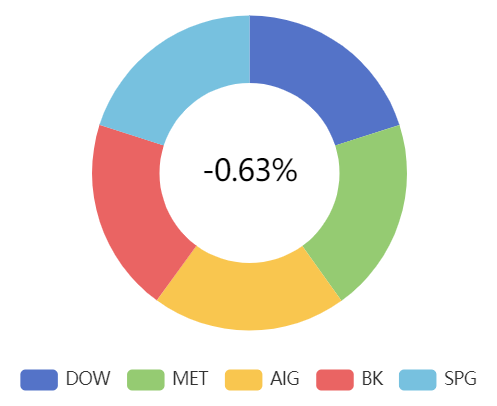
STOCKS WITH LOWEST LOADING OF FACTOR
The lowest values of the Currency Volume 756 factor are for the subsequent week observed in the following stocks: DOW, MET, AIG, BK, and SPG.
Portfolio constituents (Stocks with the lowest score)
METHODOLOGY
- We assess factors on an underlying universe of stocks, in this case the S&P 100 index.
- The selected universe is divided into 5 quantiles. Stocks with the highest value of the indicator are classified in quantile Q5, those with the lowest value in Q1.
- We calculate the performance of stocks in quantile Q5 and subtract from it the performance of stocks in quantile Q1.
- When stocks from Q5 beat those from Q1 over the long term, that means Signal Direction is upward and vice versa.
- We assess other metrics to determine the statistical significance of the factors.
- Once we know the factors and have the knowledge of which ones are really worth using, we can proceed to build qualified portfolios.
Register today & enjoy one month
FREE trial of our application
Learn how to find high-quality (statistically significant) factors and how to use factor investing in the real investment world.
‘Let’s dispense with theory and programming and get down to what portfolio managers/wealth managers or investors are interested in. That is creating an optimal investment strategy and knowing which stocks to invest in at the moment.‘
TRENDING STOCKS
For thousands of stocks, we track the number of articles issued and evaluate sentiment relative to the rolling average.
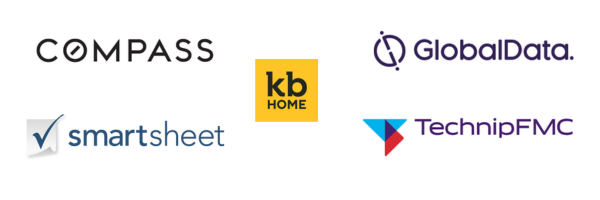
POSITIVE SENTIMENT
The tickers with the largest increase in positive sentiment articles last week were: COMP, GLDAF, KBH, SMAR, FTI.
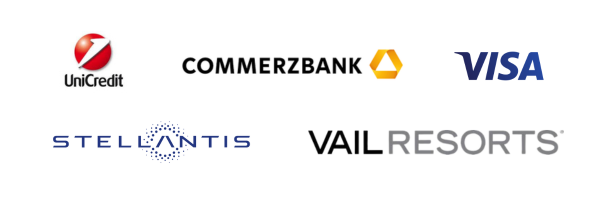
NEGATIVE SENTIMENT
The tickers with the largest increase in negative sentiment articles last week were: UNCRY, CBK.DE, STLA, V, MTN.
For AI-based concise summaries and useful meta-information, check out our app. You can also follow the daily updates on our X account Market_sentiment.