Analytical Platform brings a quant approach to managing your investments. Rely on data, statistics, and proven investment indicators to build your stock portfolio.
Trending investment indicators
The most profitable investment factor
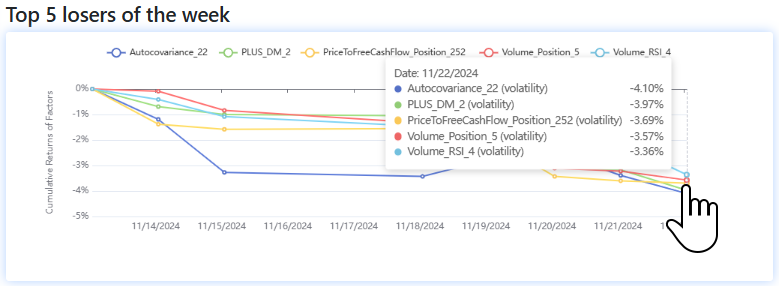
The most earning factor (indicator) in the last week has been Autocovariance 22. We wrote about this factor recently, so let’s pick another interesting one, Price to Free Cash Flow Position 252. This indicator from the Volatility category tells us how the current P/FCF value stands on the scale of the previous 252 trading days.

Analysis of the indicator Price to Free Cash Flow Position 252
Long-term Signal strength (T-Stat) is slightly below the generally accepted threshold (1.7422). Statistical confidence is above the required 95% (95.8898%). Signal direction is down, i.e. stocks with low value in the indicator outperform those with high value. For this reason, you can see a downward curve in the chart.
If we look only at the ‘Price to free cash flow‘ factor, the trend here is the opposite, and stocks with high P/FCF are rising faster than those with low P/FCF. However, the statistical metrics show insignificant results.
Stocks with the lowest indicator value
In the calculation for November 2024, PG (The Procter & Gamble Company), GS (The Goldman Sachs Group), and BA (The Boeing Company) have the lowest factor value within the S&P 100 universe.
In the Factor investing app, you can find over 1,000 investment indicators and their values for all S&P 500 stocks.
Trending stocks
The most trending ticker in terms of the number of articles written is TGT (Target Corporation) again. Unfortunately, it also holds a position in the negatively correlated ones. The biggest change in the number of positive articles over the past week has been seen by SNOW. Snowflake leads in positive sentiment because there are four times more articles written about the company overall. The ratio of positive to total is significantly higher as well.
You can find all trends, articles, and sentiments for each stock in the Market Sentiment app for free.
Register today & enjoy one month
FREE trial of our application

Trending investment indicators are calculated on the S&P 100 universe; data from November 22, 2024. Trending stocks are based on the approximately 60,000 tickers found in the analyzed articles.