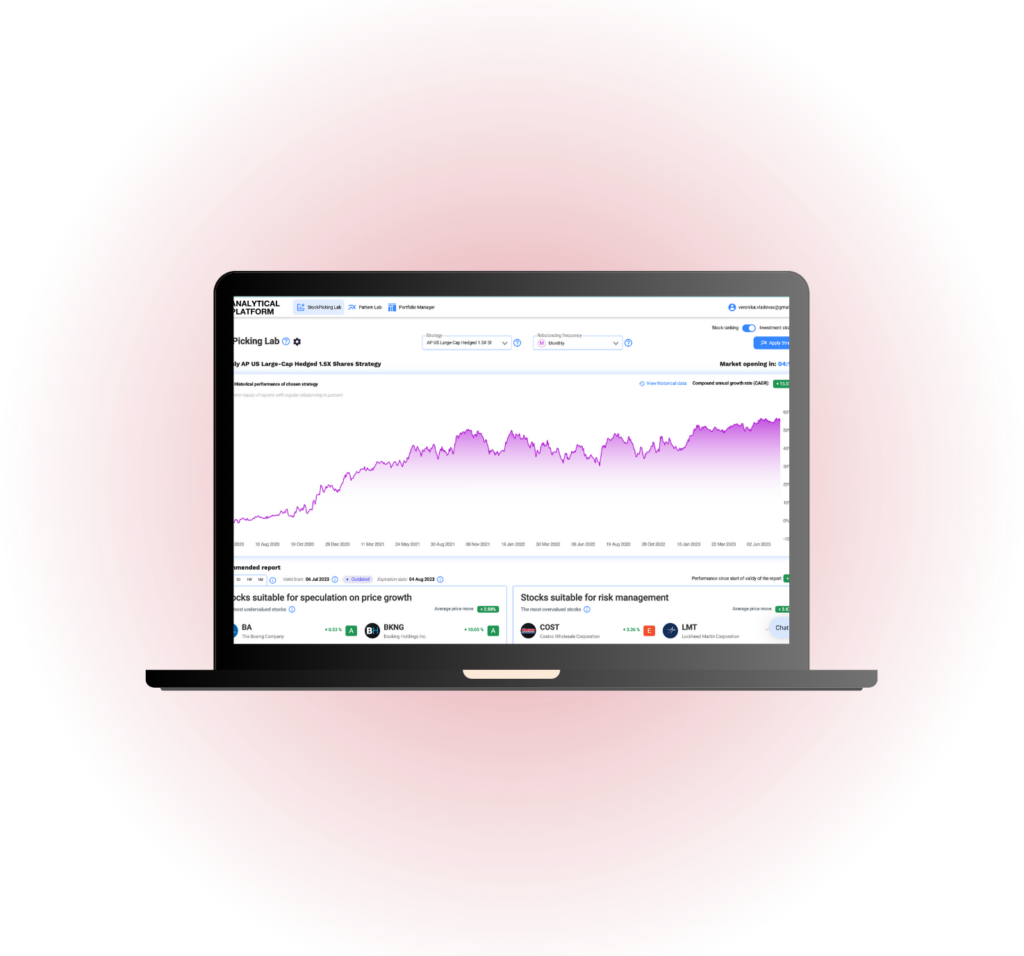
Analytical Platform brings a quant approach to managing your investments. Rely on data, statistics, and proven investment indicators to build your stock portfolio.
Trending investment indicators
The most profitable investment factor
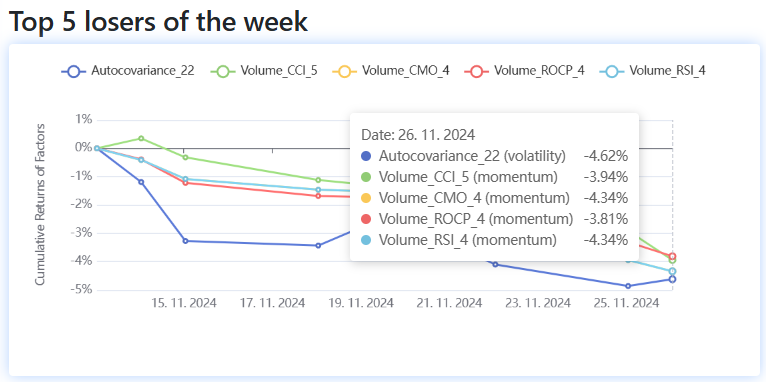
Momentum continues to rule both the rising factors and the inverse ones. Today we will look at the Volume RSI 4 factor from the Volume subcategory.

Analysis of the indicator Volume RSI 4
Investment analysts use the Relative Strength Index (RSI) to measure the velocity and magnitude of volume changes.
Long-term Signal strength (T-Stat) is low (0.7222). Statistical confidence is also insignificant (76.4712%). Signal direction is down, i.e. stocks with low value in the indicator outperform those with high value. For this reason, you can see a downward curve in the chart.
Stocks with the lowest indicator value
In the calculation for November 2024, HON (Honeywell International), TSLA (Tesla), and COF (Capital One Financial Corporation) have the lowest factor values within the S&P 100 universe.
In the Factor investing app, you can find over 1,000 investment indicators and their values for all S&P 500 stocks.
Trending stocks
The most trending ticker has been KSS (Kohl’s Corporation). First place in the Positive category has been taken by SJM (The J. M. Smucker Company). Last but not least, we can observe the biggest shift in negative articles in BBY (Best Buy Co).
You can find all trends, articles, and sentiments for each stock in the Market Sentiment app for free.
Register today & enjoy one month
FREE trial of our application

Trending investment indicators are calculated on the S&P 100 universe; data from November 26, 2024. Trending stocks are based on the approximately 60,000 tickers found in the analyzed articles.