Let’s examine how investment indicators have prospered in the turbulent year 2025.
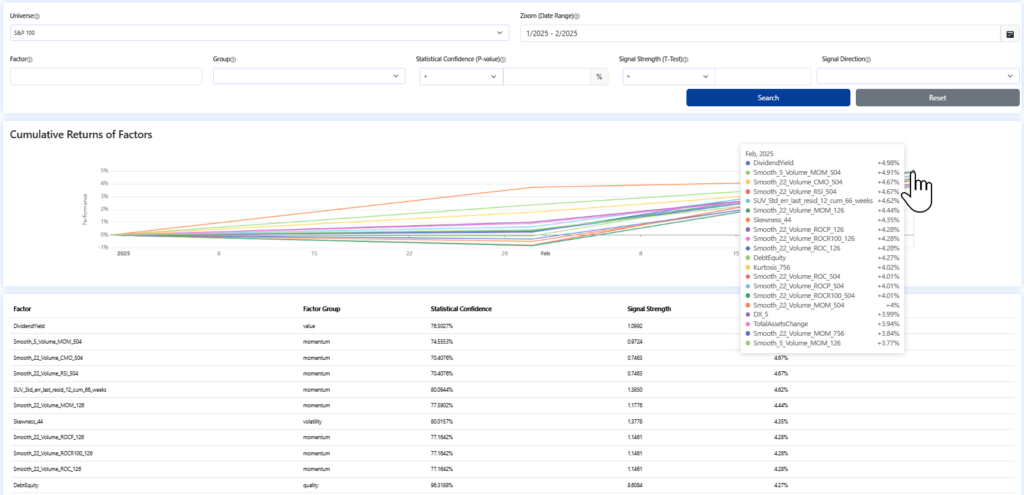
Factor Mimicking
The Dividend Yield (DY) indicator performed best[1] in the first two months of the year. As late as the end of January, the indicator’s performance was still negligible, but in February, the stocks with the highest dividends significantly outperformed the stocks with the lowest ones. And if you were to buy the 20 stocks with the highest DY this year, you would outperform the S&P 500 by 14.73%.
In this article, we will look at whether it is worth buying stocks according to their Dividend Yield[2] in the long term.
Do you want to get a report with well-performing indicators every month? Email us.
Dividend Yield Indicator Description
Dividend Yield is a financial ratio that indicates the amount of dividends that a company pays out to its shareholders relative to its market value. It’s expressed as a percentage and indicates the income an investor is getting for each dollar invested. It is a vital indicator for value investors; in other words, it belongs to value investment indicators.
In the long term, it is a statistically confident declining indicator, i.e., the stocks with the highest indicator value increase in price the slowest (even when dividends paid are included in their price). This is illustrated in the long-term tests presented later in the article.
- Signal strength (based on T-test): 1.87 (×)
- Statistical confidence (based on P-value): 96.90 % (✓)
- Signal direction: Descending (↘)
Investment Strategy Creation
According to the above factor characteristics, a long-term thinking investor is likely to say it is worth investing in stocks with the lowest dividend payout.
However, as we see right at the outset, in 2025, for example, that is exactly the kind of behavior that does not pay off. Let’s take a closer look at the performance[3] of the portfolios over different time periods.
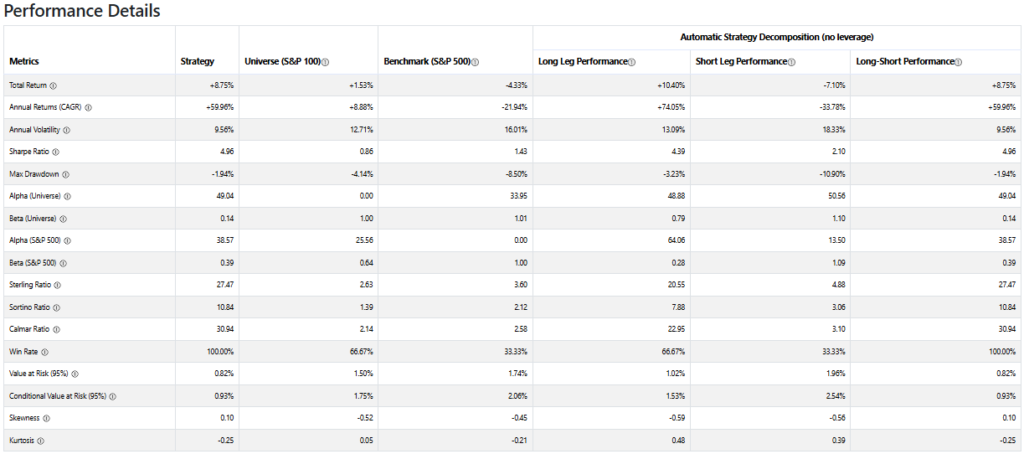
YTD 2025 Results
The 20 stocks with the highest dividend payouts have earned +10.40% this year, while the 20 stocks with the lowest dividends have lost -7.10%; the universe has made -4.33% in that time.
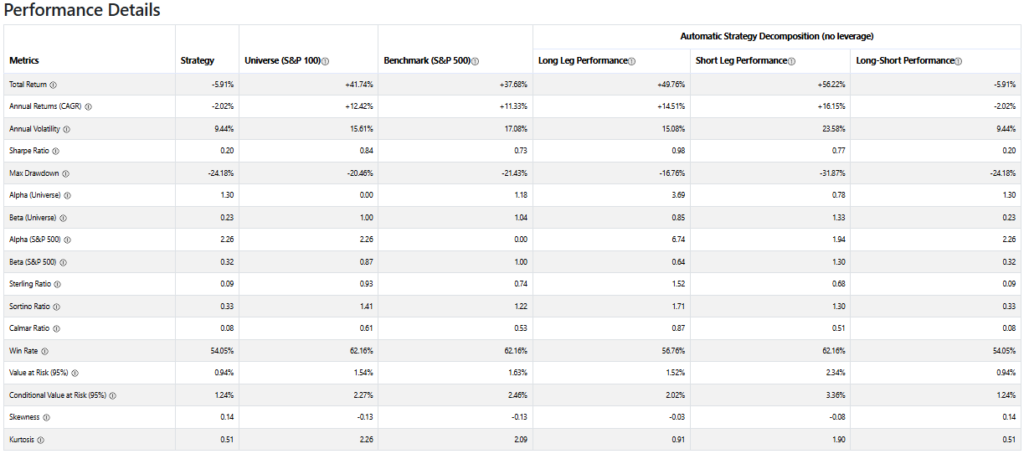
3Y Results
The stocks with the highest dividends earned +49.76%,
The stocks with the lowest dividends earned +56.22%.
The benchmark S&P 500 has done +37.68% in that time.
10Y Results
The stocks with the highest dividends earned +248.61%,
The stocks with the lowest dividends earned +875.99%.
The benchmark S&P 500 has done +222.29% in that time.
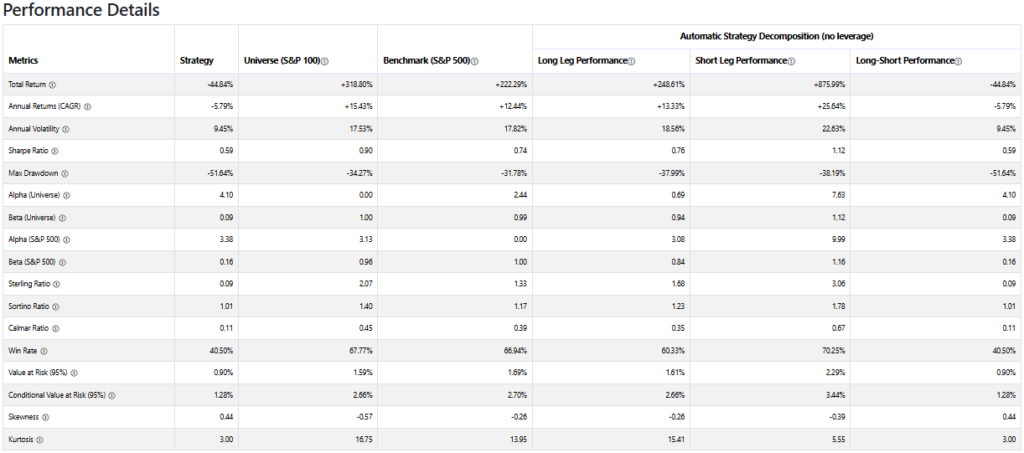
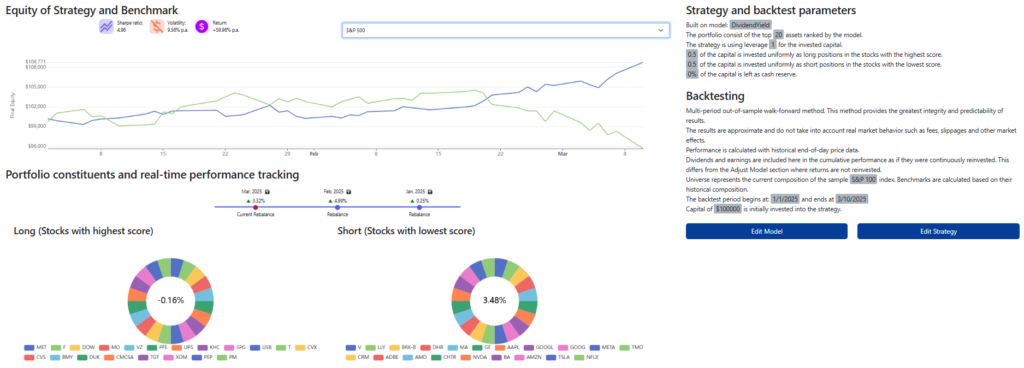
The top dividend stocks appear to be long-term laggards. However, given their outperformance of the benchmark and successful behavior in early 2025, they could be suitable for risk management.
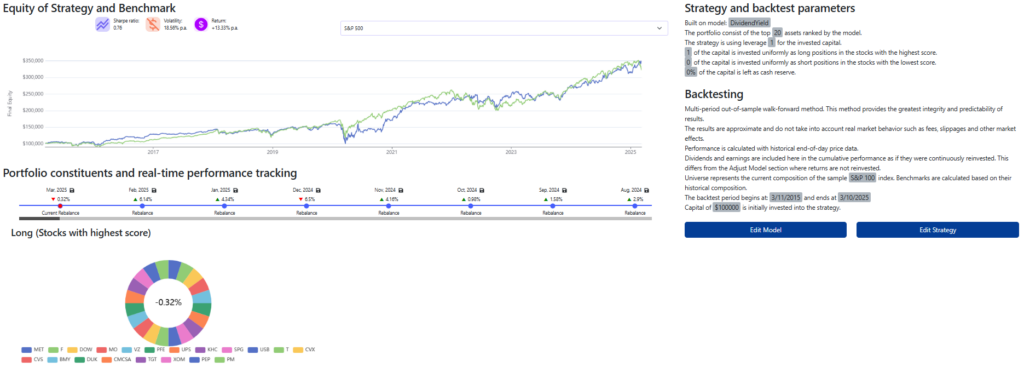
Nevertheless, the opposite is true, as a portfolio constructed of the highest dividend stocks exhibits higher volatility than the benchmark over the long term. This is more evident in the Equity curve display.
Do you want to build your investment strategies on proven investment indicators? Try one month of free access to our Analytical Platform app.
Register today & enjoy one month
FREE trial of our application
[1] The Factor mimicking procedure does not represent an exact replication of the portfolio behavior. It mainly provides information about the characteristics of the indicators for further work with them. We consider the universe of stocks from the S&P 100 index within a market-neutral portfolio.
[2] In our application, we use adjusted data, i.e., prices also include dividends paid.
[3] The process of creating investment strategies replicates the behaviour of an investment portfolio, serving as an accurate backtest before deploying the strategy.
Author: Jiří Fuchs