Our first article from the Investment MythBusters series looks at stock valuation using the Free cash flow investment indicator.
Buying stocks with good investment indicator values
Investment specialists use various techniques to build their portfolios, trade using price patterns, follow well-known investment theories such as MPT (by Harry Markowitz), use the principles of Value investing, and much more.
A typical example of Value investing is when an analyst selects stocks with low PE ratios that are undervalued relative to their competitors, or combines multiple related indicators/factors.
A common practice for investment analysts is analyzing stocks according to several indicators, which act as a filter for selecting a suitable stock. In our article Stock Screener vs. Factor Analysis, you can see how Warren Buffet selects stocks. An example of a specific stock analysis is the article from the Fintree.cz.
In our panel, we go one step further and look at which indicators have an impact on share price movements and which do not.
Stock selection based on Free cash flow (FCF)
- The theory at Investopedia says: ‚Increasing free cash flow to outstanding shares value is a positive, as a company is regarded as improving prospects and more financial & operational flexibility.‘
- But how does the price of high FCF stocks grow compared to those with low Free cash flow? [1].
Broad Free cash flow portfolio/index results
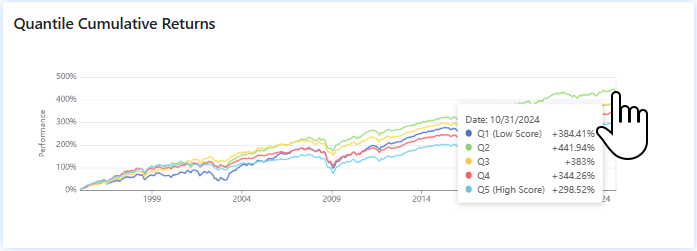
First, we split the S&P 500 index into 5 quintiles of ‘100’ stocks and descendingly order them by the values of their FCF. The stock with the highest FCF is ranked first and it is in the Q5 quantile.
The stocks with Free cash flow ranked 301st to 400th have appreciated the most since 1995. Stocks with the highest FCF value, which are at the 1-100 spot, have grown the slowest.
The long-term signal strength (T-Stat) is relatively high, but it does not reach the threshold of 1.7698. The statistical significance (P-Value) is within the required limits of 96.1197% and the direction of the signal is downward, i.e. the lowest-valued stocks rise faster than the highest-valued ones.

This trend has been confirmed over the last 10 years as well. Thus, we can say that in the case of a broad stock portfolio, stocks with a slightly sub-average FCF value increase in price the fastest in the long run, while those with a high FCF value rise in price the slowest.
Building a portfolio of 5/20 stocks
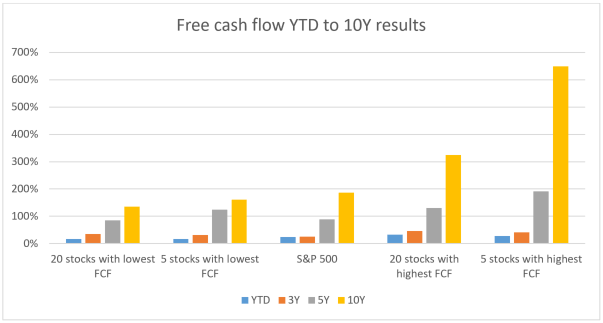
If we want to form smaller portfolios with 5-20 stocks, we get different results over the last 10 years.

Portfolios composed of only 5 to 20 stocks with the highest FCF value significantly beat the underlying benchmark. The 20 stocks with the lowest FCF value did not outperform the S&P 500 benchmark on the time series shown. The 5 stocks with the lowest FCF outperformed on the 3Y-5Y interval.
Summary
From a statistical point of view, Free cash flow is not a significant investment indicator. Although it does not achieve bad T-Stat and P-Value values, statistically stronger indicators can be considered for the construction of an investment portfolio. For those indicators, for example, the trend on broad quantiles matches the results of smaller stock portfolios.
This is in line with the inconsistent results:
- A small number of stocks (5-20) with the highest FCF values significantly outperform their underlying benchmark.
- When working with large portfolios (100 stocks), shares with a sub-average Free cash flow perform best. Meanwhile, the group with the lowest FCF outperforms the stocks with the highest Free cash flow in price growth.
Register today & enjoy one month
FREE trial of our application

[1] The way we trade is that we adjust the portfolio once a month according to the current FCF values of individual companies.