An investor’s view
When evaluating investment strategies, two prominent tools stand out. Factor analysis and stock screener. Both serve the purpose of identifying potential stock investments but differ in methodology, depth, and application. In this article I will explore the differences between the two, and how investors can use these tools to enhance their portfolio performance.
What is stock screener?
Stock screener is a digital tool that helps investors filter stocks based on specific criteria or parameters. The filters often include fundamental metrics, for instance price-to-earnings ratio (P/E), market capitalization, dividend yield, or growth rates. These tools are widely used for quickly narrowing down thousands of stocks to a manageable list based on the desired characteristics.
Key features of a stock screener
Simplicity and speed
Stock screeners allow investors to apply a wide range of criteria, providing a snapshot of companies that meet specific conditions.
Customizable filters
Investors can tailor filters to match their investing style, such as value investing (low P/E, high dividend) or growth investing (high revenue or earnings growth).
Technical and fundamental metrics
Stock screeners can include both technical indicators (like moving averages or RSI) and fundamental metrics (like earnings per share or debt-to-equity ratio).
Access to large datasets
Many screeners provide access to a comprehensive database of publicly traded stocks from major exchanges. This opens up a global reach to investors.
What is factor analysis in investing?
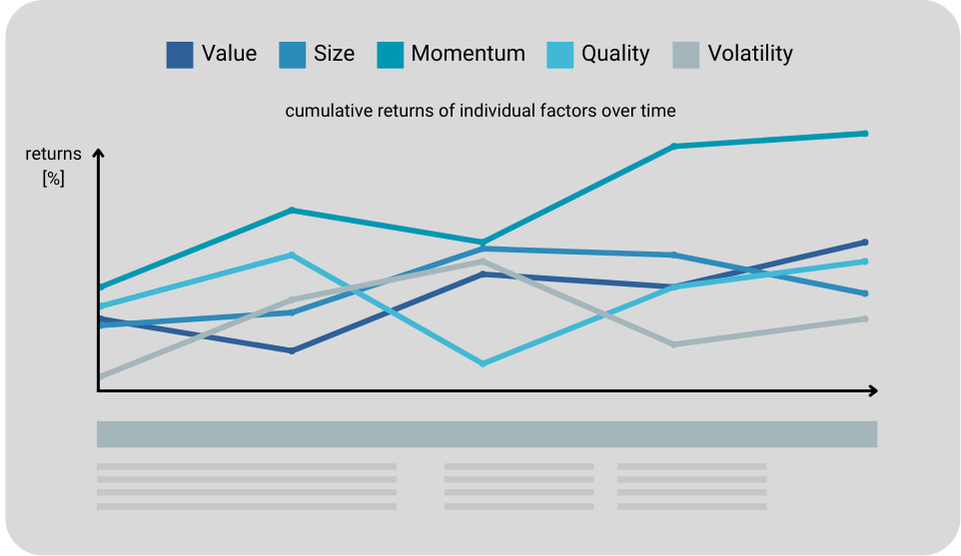
Factor analysis in investing refers to a more advanced, data-driven approach that evaluates performance of individual stocks or portfolios based on underlying factors or characteristics. These factors typically include market risk (beta), value, size, momentum, quality, and volatility. The goal here is to understand what are the drivers of a stock’s performance and how it fits into an overall portfolio strategy.

Key features of factor analysis
In-depth analysis
Factor analysis goes beyond surface-level metrics by evaluating the systematic drivers of returns. This method helps investors understand the broader influences on stock performance.
Portfolio optimization
Factor analysis is crucial when constructing portfolios that maximize returns while controlling the risk. By understanding the factors driving returns, investors can build better balanced and diversified portfolios.
Risk management
Factor analysis enables investors to identify and mitigate risks linked to specific factors, for instance when a portfolio is being too exposed to growth or value stocks.
Multi-factor models
The combination of several factors, such as momentum, low volatility, and quality, is the most advanced way of building portfolios. Resulting multi-factor model provides a data driven tool that is able to manage risk-adjusted returns by providing regular rebalances of the portfolio.
Stock screener vs. factor analysis
| Stock Screener | Factor Analysis | |
|---|---|---|
| Complexity | Simple and easy to use. Suitable for investors who want a quick list of stocks that meet predefined conditions. | More complex, it’s leveraging deeper understanding of financial markets and statistical models. Ideal for institutional investors or experienced retail investors focused on portfolio construction and optimization. |
| Objective | Helps investors identify individual stocks that fit their strategy (e.g., growth, value, dividend investing) based on quantifiable data. | Aims to explain stock performance based on broader, systematic influences. This method helps in understanding why certain stocks outperform or underperform the market. |
| Scope | Focuses primarily on individual stocks and specific metrics like earnings, revenue growth, or technical indicators. | Looks at portfolio-level decisions and how various factors contribute to overall performance. It’s more macro in its outlook, often used in portfolio management. |
| Data Usage | Uses historical financial data and market metrics to create a list of potential stocks based on investor-defined criteria. | Uses historical financial data and market metrics to create a list of potential stocks based on investor-defined criteria. |
| Application | Commonly used by retail investors, day traders, and those looking for quick insights into specific stocks. | Often used by portfolio managers, hedge funds, and institutional investors aiming for risk-adjusted returns. |
Who is it for?
Beginners or retail investors
Stock screeners are an excellent starting point. They’re easy to use, accessible, and provide a basic yet effective way to filter stocks based on your investment goals. Whether you’re looking for undervalued stocks or companies with high growth potential, stock screeners can help you identify opportunities quickly.
Advanced or institutional investors
Factor analysis is more systematic approach. If you are building a diversified portfolio or trying to manage risk exposures, factor analysis provides deeper insight into what drives performance. This is particularly useful when constructing multi-factor portfolios or optimizing specific risk-return trade-offs. Due to the data-driven approach, the aforementioned trade-offs are regularly monitored and corrected whenever underlying conditions shifts over time. This systematic style of managing portfolios classifies factor driven portfolios as quant portfolios.
How to use
Although they may seem similar at first, stock screening and factor analysis are very different in their approach to investing.
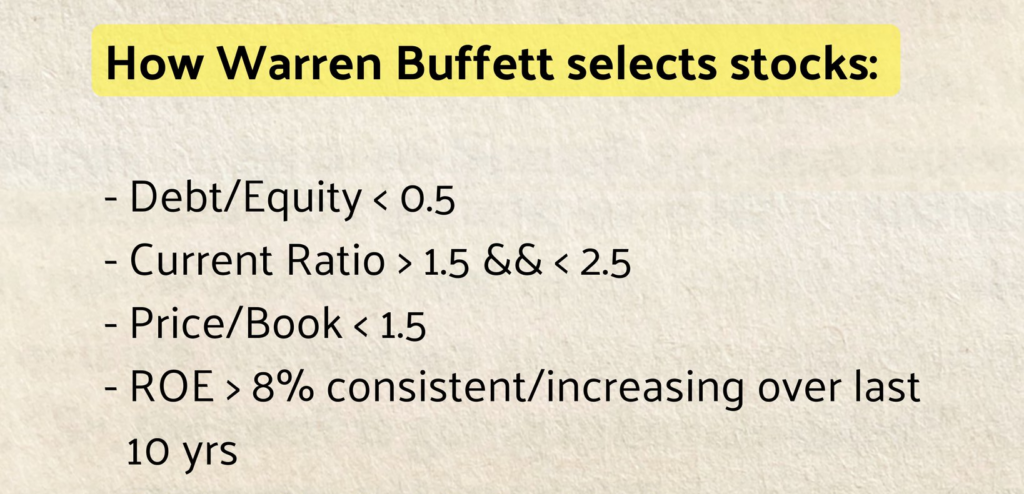
Stock screener expects that you already have a clear vision in your mind about characteristics of the company you are looking for. The tool then helps you narrow down the list of good candidates. So you have to do your homework upfront, you have to put together the desired characteristics, that describes the good company for your portfolio. Is the Debt/Equity ratio < 0.5 good? Is company with the ratio 0.55 that much worse in comparison? You have to answer these questions yourself.
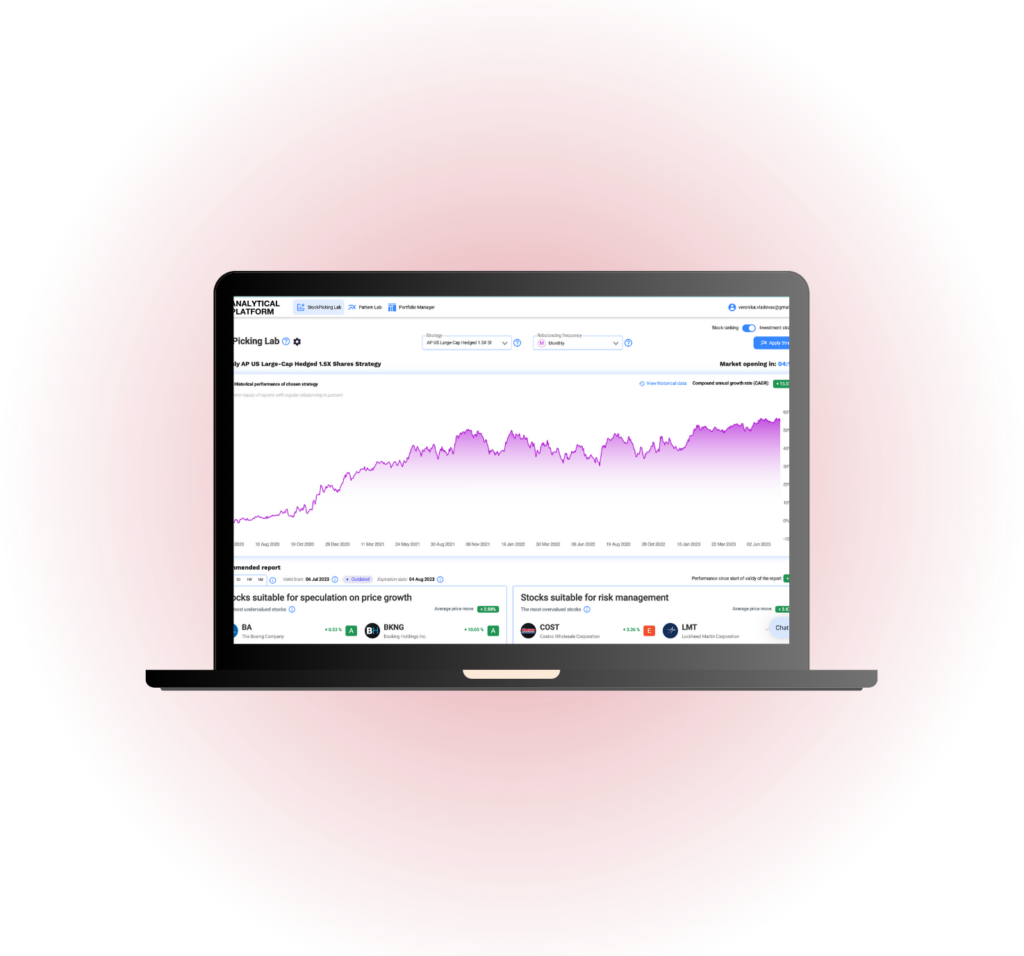
Using the aforementioned example with Debt/Equity ratio, the factor analysis process examines companies with both high and low exposure to that factor. Consequently the process determines if companies with high exposure fares consistently and with statistical confidence better than companies with low exposure. If the answer is yes, then this factor influence the price and is considered as one of the drivers of both risk and returns. The goal here is to find influencing factors and determine the degree of their influence. Analytical Platform makes this process really easy, the refreshed up-to-date list of factors is always prepared for your use.
Once you have the list of factors and their characteristics, you can just pick the one that fits your investment portfolio. Depending on your requirements, it can be low volatility factor to manage risk, factor with high returns to increase profits or one of the factors based on academic research like Fama-French 5 factor model. You can also use more advance approach and target multiple factors at the same time to better diversify your portfolio.
Conclusion
Both stock screeners and factor analysis are valuable tools in the investor’s toolkit, each offering distinct benefits. Stock screeners provide a quick, efficient way to sift through thousands of stocks, while factor analysis offers deeper insights into the systematic drivers of returns. Understanding how and when to use these tools can significantly improve an investor’s ability to make informed, strategic decisions in building a robust portfolio. Whether you’re a novice looking for stock ideas or a seasoned investor managing risk, these tools can be tailored to your specific investment needs.
As quant investment strategies are becoming more and more popular, we at Analytical Platform strongly believe factors now have real transformative potential that should not be missed.
Vladimír Vacula
Register today & enjoy one month
FREE trial of our application

