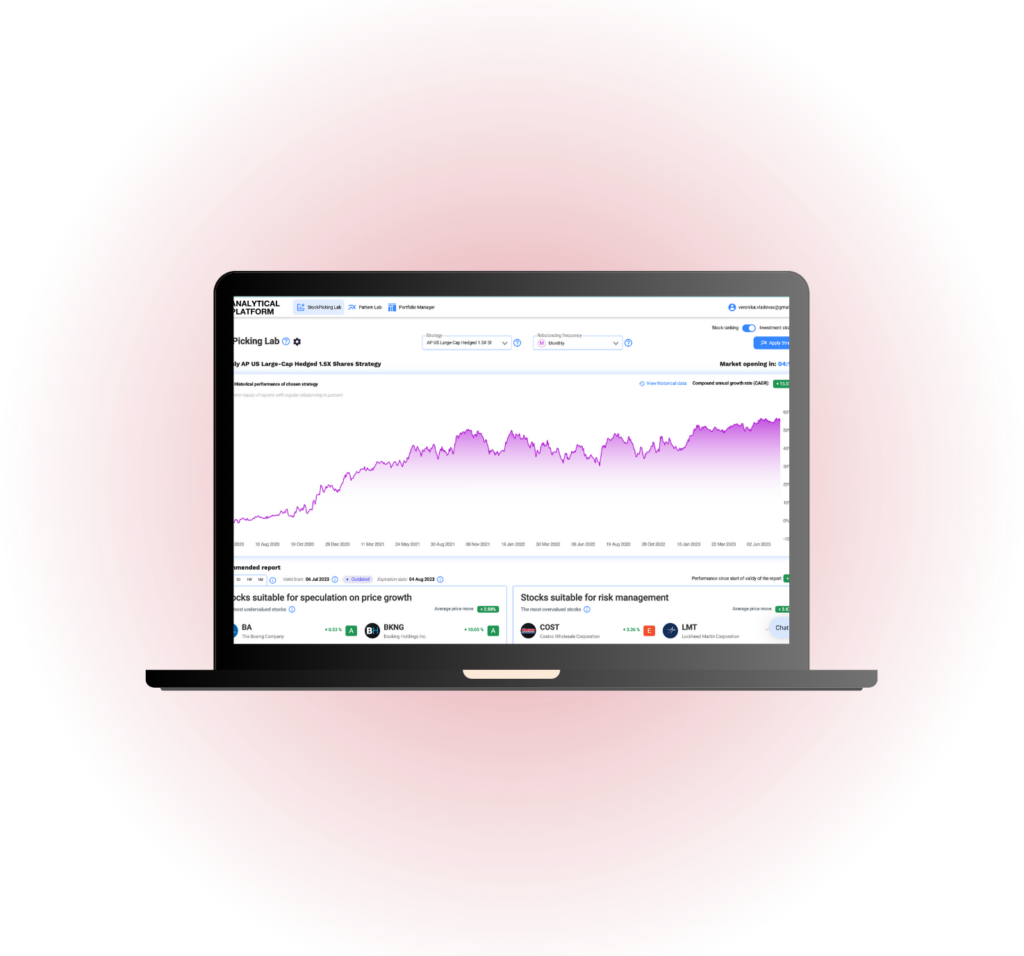
Portfolio Manager
Software for Application of Markowitz’s Modern Portfolio Theory
The Portfolio Manager web application leverages proven Markowitz’s Modern Portfolio Theory to provide you with professional-level portfolio management skills.
What are the benefits for you?
Is your portfolio really well collected? Compare it with the efficient frontier. With our application you can easily determine whether your portfolio is well-balanced and if rebalancing could increase returns or decrease risk.
Application provides you with the ability to set specific limitations such as minimum or maximum weight for stocks in the portfolio, presence of arbitrary stock, or the maximum number of companies included in the portfolio.
How to use it?
We assume you already have a portfolio (but it is optional). If so, the fundamental use case is the following, and it only takes a few seconds:
STEPS
01.
Submit your positions easily
02.
Check your risk-performance metrics on graphs and charts
03.
Compare your current portfolio with efficient ones (on efficient frontier)
04.
Choose a new portfolio collection by your risk-aversion profile
Register today & enjoy one month
FREE trial of our application

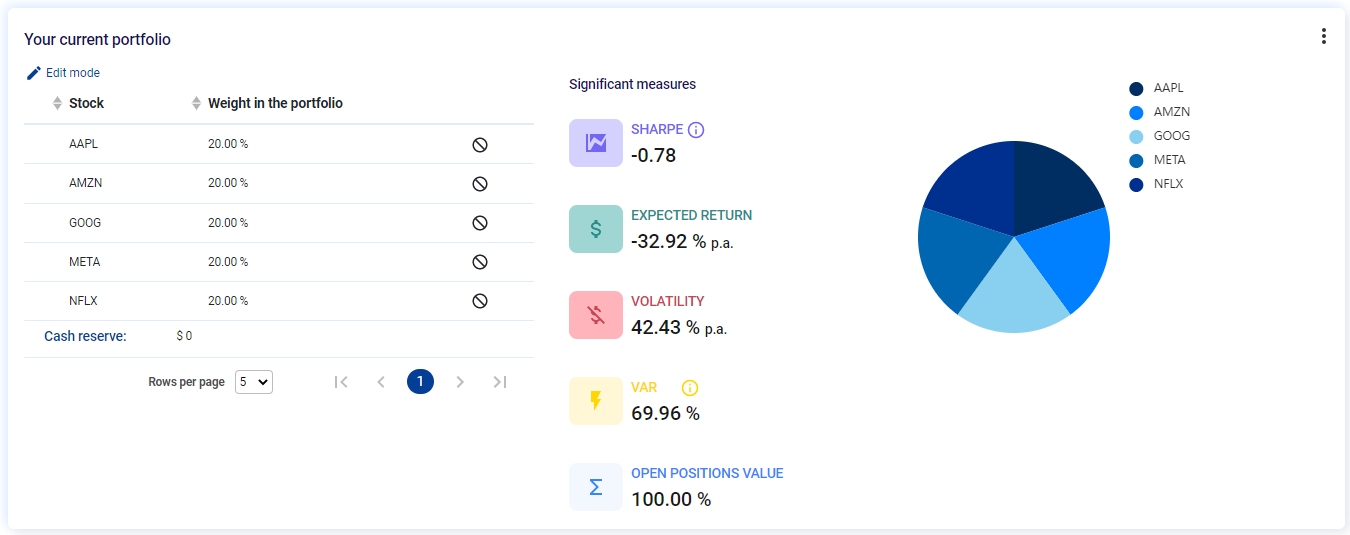
According to Markowitz’s Modern Portfolio Theory we take your portfolio and calculate risk-performance metrics. Expected return, volatility, Sharpe ratio, and value at risk. Let’s have an example of a portfolio (equally weighted FAANG).

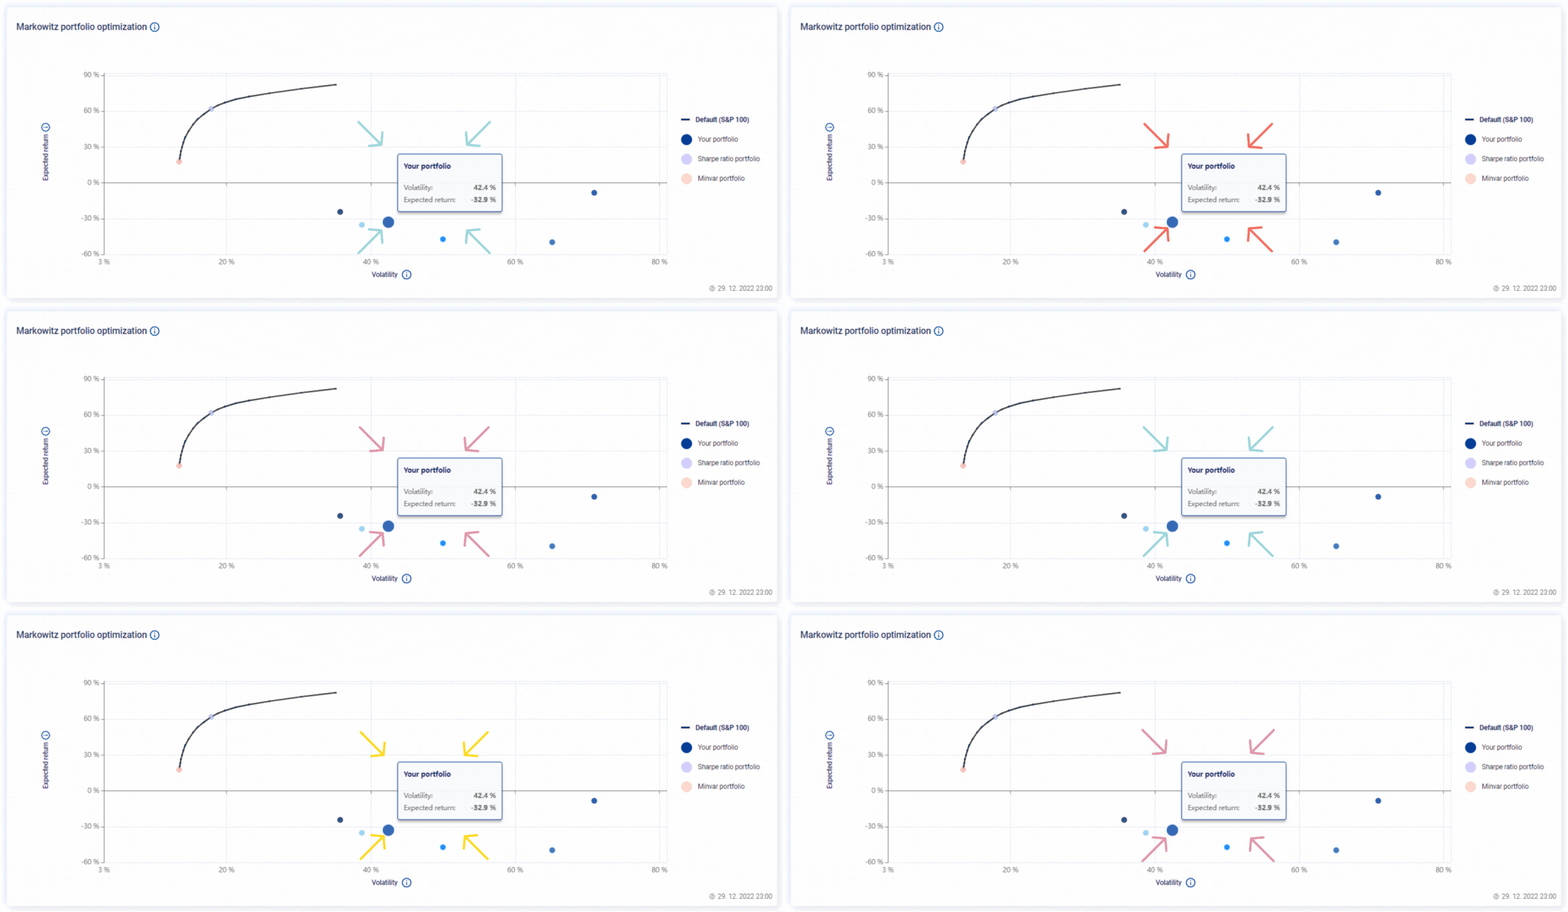
Then let’s analyze your portfolio against efficient frontier. One important thing should be mentioned in this place: efficient frontier is calculated from a specific pool; in this case, it is companies involved in S&P 100 index. If you would like to use only FAANG stocks, you can specify your own pool.
The efficient return and volatility (riskiness) of your portfolio determine a location in a graph, based on Markowiz’s model.
The blue point shows the location of your portfolio, and the x-y coordinates represent the risk and reward of that portfolio.

A curve in the plot is an efficient frontier that is created by points representing the set of optimal portfolios sorted by investment risk aversion – the short end starts with a minimal volatility portfolio, and the continuum goes to the right, ending up in the portfolio with the highest return.
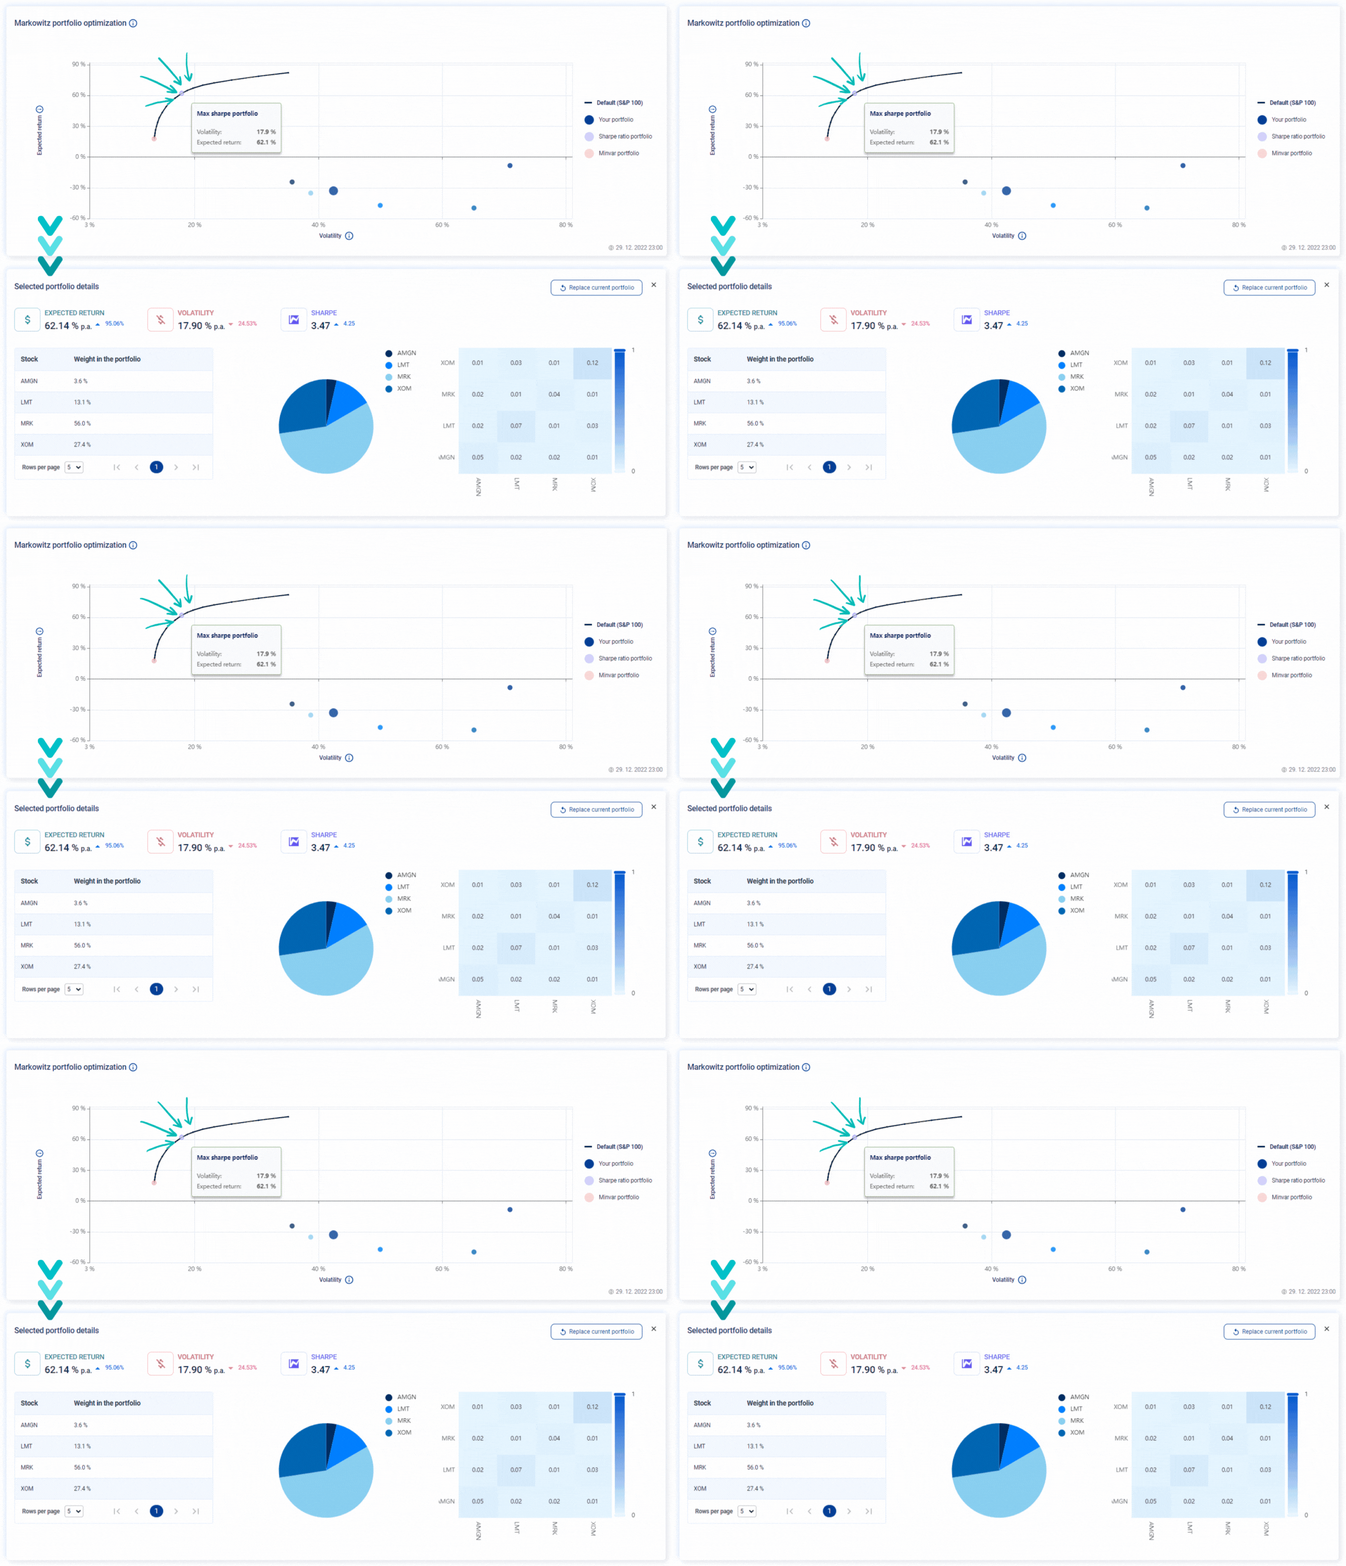
You can choose an arbitrary point lying on the curve, and then detailed information is revealed. In line with Harry Makowitz’s theory.

How do we translate into practice Markowitz’s Modern Portfolio Theory?
Video Guides
Custom Portfolio Creation Analysis: Maximize Your Investments
Explore the Portfolio Optimization app and learn to create, analyze, and optimize custom portfolios. Make informed investment decisions and improve your returns with ease.
Smart Portfolio Management: Stock Replacement for More Efficient Portfolio
Learn to replace a specific stock while minimizing transaction costs and making data-driven decisions.
Effortless Portfolio Optimization: One Click for Maximum Performance
Master the Portfolio Optimization App and learn how to make a single change to your portfolio without specifying a stock to remove. Optimize your investments based on your chosen objective function.